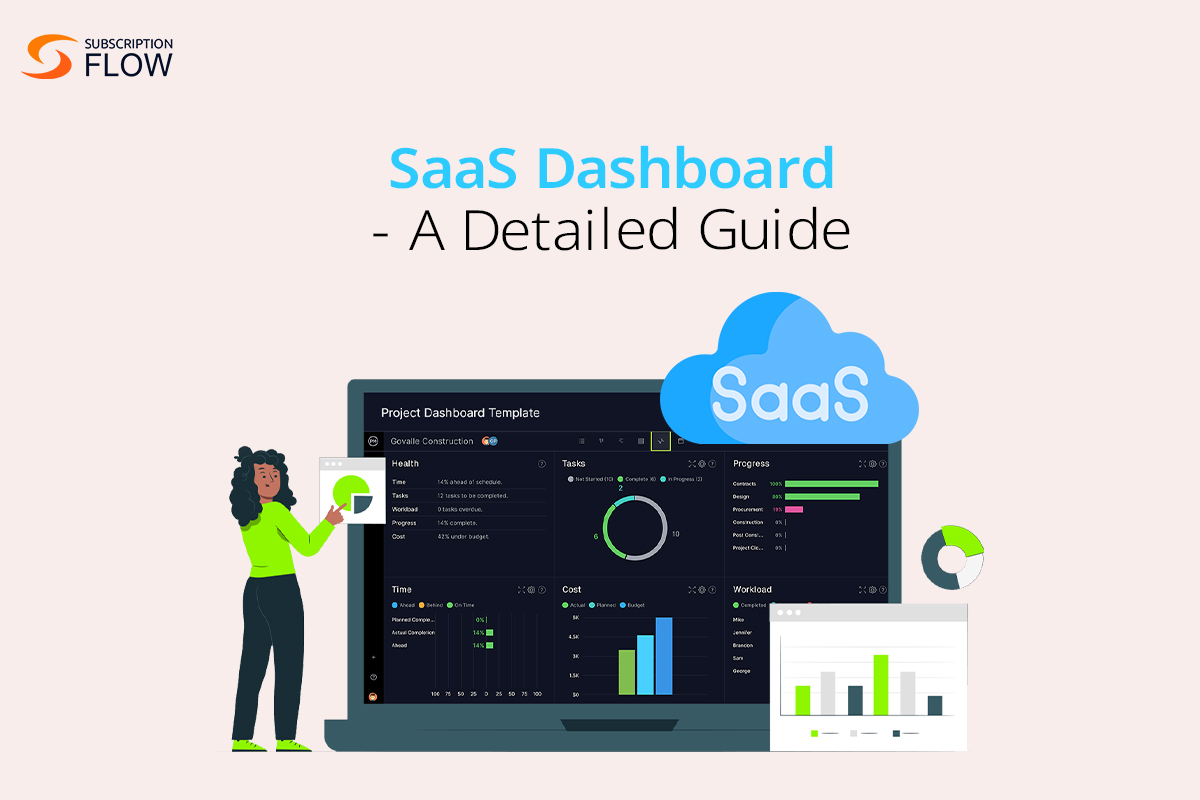
SaaS Dashboard – A Detailed Guide
In this Age of Information, digital technologies have progressed to the point that a plethora of tools, applications, and platforms are available to improve the way businesses operate in a variety of sectors.
In the last five years, software-as-a-service (SaaS) has grown exponentially, and the public SaaS market is predicted to increase exponentially this year and beyond. Without a doubt, the SaaS business has a bright and profitable future, but with new ideas coming all the time, competition has never been stronger.
If you’re a growing SaaS firm trying to accelerate your success, using the power of data is the way to achieve a true competitive advantage. This is where SaaS dashboards come into play.
These are powerful business intelligence tools that provide numerous advantages to forward-thinking technology companies. Here, we’ll look at what SaaS dashboards are, why they are important, which components and metrics to include in your dashboard, and how to select the right dashboard to meet your business needs.
Let’s get this party started.
What is a SaaS Dashboard?
A SaaS dashboard is a business tool that gives users real-time access to SaaS applications. It enables enterprises to monitor and analyse key data metrics and KPIs (for example, CAC, MRR, ARPU, CLTV, and so on), providing the data required for data-driven decision-making and application optimisation.
Why is a B2B SaaS Dashboard Important?
Let’s take a look at reasons why a B2B (Business-to-Business) SaaS (Software as a Service) dashboard is important for a business to succeed on multiple fronts:
Data Visualization and Insights
It displays vital indicators and data relevant to the business in a visual format. This enables rapid and easy performance and trend analysis.
Real-Time Monitoring
It provides near-real-time updates on crucial business indicators. This allows for fast decision-making and adaptation to changing conditions.
Centralized Information Hub
It serves as a repository for all key company data. This reduces the need to manually collect information from several sources, saving time and lowering the chance of error.
Performance Tracking
It aids in tracking the performance of many business components such as sales, marketing, customer interaction, and financials. This provides a thorough insight into the company’s performance.
Goal Alignment
It brings teams and departments together around shared goals and KPIs. This improves teamwork and accountability by fostering a shared understanding of priorities and objectives.
Customer Insights
Understanding client behaviour and preferences is critical for B2B organisations. A dashboard can provide information on client interactions, purchasing history, and levels of satisfaction.
Forecasting and Planning
It makes data-driven forecasting and planning possible. Businesses may generate more accurate predictions and plan accordingly by analysing past trends and present performance.
Resource Optimization
It aids in determining where resources can be optimised or redeployed. This may result in cost savings and increased operational efficiency.
Customer Communication and Reporting
A well-designed dashboard can be shared with clients or stakeholders to provide transparency and insights about the services or goods they receive.
Adaptability to Change
The ability to quickly adjust to new knowledge and changing situations is critical in a dynamic corporate environment. A dashboard gives the visibility required for quick decision-making.
READ MORE: The Roadmap to Success: The Customer Retention Dashboard
Key Components and Selecting Metrics
A good SaaS dashboard is made up of numerous key components. It focuses on actionable analytics, provides real-time data updates, and provides customization possibilities to match the specific demands of each business.
- Metrics that are actionable: The dashboard should provide valuable insights into the operation of the business, such as user engagement, churn rate, customer acquisition cost, and lifetime value.
- Real-Time Data Updates: SaaS Dashboards should be able to update data in real-time, ensuring that businesses have access to the most up-to-date information for informed decision-making.
- Customization: Because every organisation has different demands, an efficient SaaS Dashboard allows users to tailor it to their own requirements, focusing on the indicators that are most important to them.
Here are some metrics you should definitely include in your B2B SaaS Dashboard:
1. Monthly Recurring Revenue (MRR): The monthly revenue generated by subscriptions.
2. Annual Recurring Revenue (ARR): The amount of revenue generated each year via subscriptions.
3. Churn Rate: The percentage of consumers who quit their memberships during a given time period is referred to as the churn rate.
4. CAC: The average cost of gaining a new customer, including marketing and sales expenses.
5. Lifetime Value (LTV): The estimated net profit generated by a client over the course of their relationship with the company.
6. LTV: CAC Ratio: The ratio of Lifetime Value to Customer Acquisition Cost used to evaluate a company’s customer acquisition efforts.
7. ARPU: The average revenue generated per user or customer is derived by dividing total revenue by the number of customers.
8. Customer Retention Rate: The percentage of customers who remain with the company.
READ MORE: Metrics that Matter: A Deep Dive into MRR, ARR, Churn, and ARPU for Subscription Business Models
Choosing the Right SaaS Dashboard
Choosing the right SaaS dashboard depends on several factors that are specific to your business needs and goals.
Here’s a step-by-step guide to help you make an informed decision:
1. Define Your Objectives
Start by understanding what you want to achieve with the dashboard. Are you looking to track sales, monitor marketing metrics, manage projects, or something else entirely?
2. Identify Key Metrics
Determine the key performance indicators (KPIs) and metrics that are critical for your business. These will vary depending on your industry and specific goals. We have already discussed the 8 metrics that you should definitely include, but feel free to add more to the list depending on your business goals.
3. Consider User-Friendliness
It seems obvious, but a dashboard should be intuitive and easy for your team to use. It shouldn’t require extensive training to get started, this will save your team a lot of time and exertion that is unnecessary.
4. Customization and Flexibility
Look for a dashboard that allows you to customize the layout, widgets, and reports to suit your specific needs.
It should be flexible enough to adapt to changes in your business. SubscriptionFlow is a subscription management software that handles all your data in one place and allows for highly customizable dashboards so you can gain the best insights for your strategy.
5. Integration Capabilities
Ensure that the dashboard can integrate with your existing tools and systems (e.g., CRM, ERP, marketing platforms), so your data isn’t dispersed. This helps in creating a seamless workflow. SubscriptionFlow is integrated with multiple platforms like SugarCRM, QuickBooks, payment gateways, and much more to create these seamless workflows.
6. Data Sources
Determine where your data comes from and make sure the dashboard can connect to those sources. It could be APIs, databases, spreadsheets, or other sources.
7. Real-Time or Periodic Updates
Decide if you need real-time updates or if periodic (daily, weekly) updates are sufficient for your reporting needs.
8. Data Visualization
Consider the visualization options provided by the dashboard. It should present data in a clear, meaningful, and visually appealing way. SubscriptionFlow’s dashboards are highly customizable so you can present your data in a way that’s meaningful to your firm.
9. Collaboration Features
If you have a team, look for features that allow for easy collaboration. This could include shared dashboards, commenting, and role-based access.
10. Mobile Compatibility
With the multiple-screened fast-paced business environment that businesses now operate in, having a dashboard that is mobile-friendly is crucial for on-the-go access.
11. Security and Compliance
Ensure that the dashboard complies with industry-specific regulations and meets your security requirements. This is especially important if you’re dealing with sensitive or confidential data.
12. Scalability
As your business grows, you’ll want a dashboard that can scale with you. Choose a dashboard that can handle larger volumes of data and increased usage.
READ MORE: Money Metrics – Using Revenue Dashboards the Right Way
Final Word
Thus, a SaaS dashboard is crucial for enabling data-driven decision-making, improving operational efficiency, enhancing customer relationships, and gaining a competitive advantage in the marketplace. It provides a powerful tool for managing and growing a B2B business effectively.
By carefully considering the aforementioned factors, you can make an informed decision and choose a SaaS dashboard that aligns with your business objectives and requirements. Book a demo with us to find out how SubscriptionFlow’s dashboard can take your data-based strategy to the next level.

